
Column summaries
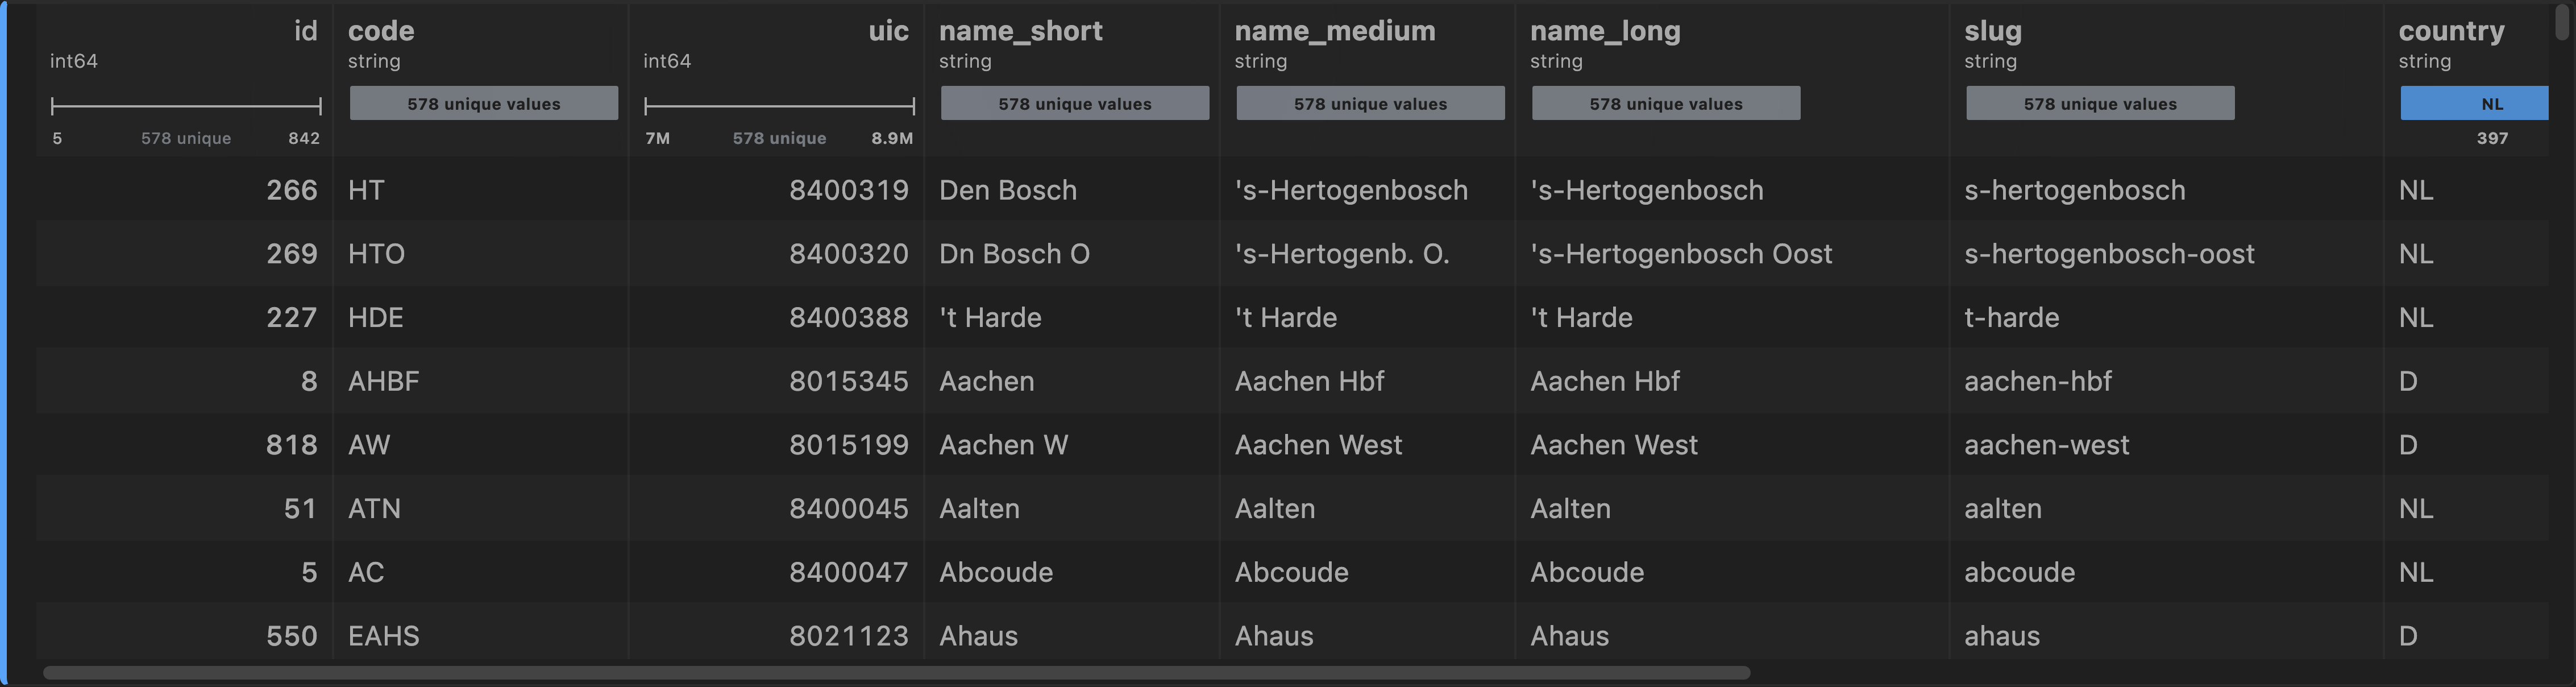
Open a table and every column comes with its own shape: a histogram for numbers, a box plot for distributions, a split bar for categories, a unique count for identifiers, the range underneath. It answers "is this the file I want?" without a line of pandas — computed locally, straight from the file you are looking at.
| Column kind | What is drawn |
|---|---|
| Number | a histogram, with the minimum and maximum under it |
| Date | a histogram over time |
| Category | a split bar of the commonest values, and how many are left |
| Identifier | the count of distinct values |
| Boolean | the true/false split |
The same statistics are what a chart cell reads to decide which plots the columns can support, and what a model cell reads to tell a measurement from a row number.
Works on Parquet, CSV, TSV, JSON, JSONL, Arrow, ORC, Avro, xlsx, SPSS .sav and SAS .xpt / .sas7bdat.
Next: search.